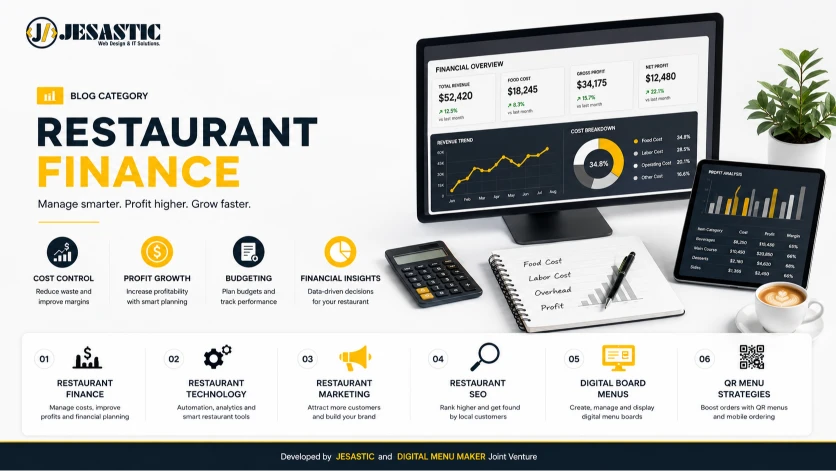
The Blueprint to Precise Food Cost Management
Managing a commercial kitchen without tracking exact financial variance is equivalent to steering a cargo ship with a broken compass. In the food service sector, where margin tolerances consistently hover between 3% and 7%, minor back-of-house tracking failures do not simply lower net yields—they shut operations down permanently. Executing a strict system for food cost management is the single most definitive way to ensure your brand sustains continuous profitability.
Many independent owners examine their purchasing invoices, review aggregate sales numbers at the end of a physical operational tracking cycle, and assume they understand their financial positioning. This passive methodology is high-risk. True cost containment requires deep structural visibility over menu ingredient pricing steps, daily tracking cycles, and real-time inventory adjustments.
The Structural Calculus of Cost Accounting
To assert total control over your inventory asset landscape, you must accurately calculate your Actual Food Cost Percentage across regular, repeating weekly schedules. Relying on random monthly overviews delays your ability to isolate theft, unrecorded ingredient waste, or line-level tracking slip-ups until it is too late to fix the fiscal damage.
To execute this framework accurately, kitchen teams must complete physical inventory counts with zero tracking variables. Every case of protein, bulk storage unit, and prepared line component must be weighed, logged, and priced based on current wholesale acquisition values. Guessing or using arbitrary approximation values compromises the integrity of your entire operational matrix.
Isolating and Eliminating Theoretical vs. Actual Variance
The true key to world-class back-of-house efficiency lies in identifying your inventory variance. Theoretical food cost represents what your kitchen should have spent based on the exact counts of dishes sold through your POS interface. Actual food cost represents what you spent based on real storage room reductions.
The space between these two values is known as the variance. In poorly managed operations, variance metrics frequently reach 3% to 5% of gross revenue—representing thousands of dollars leaking straight into garbage bins or back-door security gaps. Minimizing this gap down below 1% requires a multi-layered strategy:
- Standardized Recipe Injections: Every dish must feature strict ingredient scale parameters down to the exact gram or ounce. Line cooks must utilize portion scoops and digital scales for high-cost proteins.
- Waste Log Enforcement: Kitchen staff must log every dropped tray, burned component, or expired ingredient into a physical system terminal before discarding it.
- Yield Optimization Steps: Wholesale vegetable and meat butchery yields must be evaluated regularly to ensure your raw fabrication metrics match recipe calculations.
Leveraging Digital Infrastructure to Drive Profits
Manual data management slows down operational adjustments. Modern brands resolve these tracking strains by deploying dedicated cloud systems. Transitioning static front-of-house menus into a modern, integrated mobile QR menu ecosystem drastically improves your historical consumption tracking capabilities.
When customer transactions funnel through organized digital nodes, your menu data links directly to back-of-house processing frameworks. This real-time visibility allows you to implement automated modifications, adjusting pricing layouts instantly via your central management dashboard if a particular wholesale distributor hikes meat or produce costs unexpectedly.
Furthermore, deploying automated interfaces speeds up your administrative operations. Instead of forcing managers to manually adjust physical signage elements or rewrite dry-erase boards during shifting item configurations, pricing adjustments apply globally in seconds across all synchronized restaurant screen displays at your counter terminals.
Advanced Engineering Patterns for High Margin Mixes
Once your cost metrics align with target projections, the final operational stage involves guiding consumer selection paths toward high-yielding profiles. A highly effective method is organizing your digital layouts around proven menu engineering concepts.
By using clean structural grids, strategic negative boundaries, and isolated placement cards on your digital displays, you guide consumer attention directly toward your signature items—the profiles that carry low ingredient costs but generate premium transactional yields. This architectural alignment turns simple screen layouts into active visual upselling systems.