Leveraging Restaurant Analytics to Drive Data-Backed Decisions
Operating a hospitality business based on intuition is a relic of the past. In a highly competitive, low-margin environment, raw gross sales numbers at the end of the night tell you absolutely nothing about the actual health of your business. Did a busy Friday night yield a high net profit, or did overtime labor and unrecorded food waste silently eat the margins?
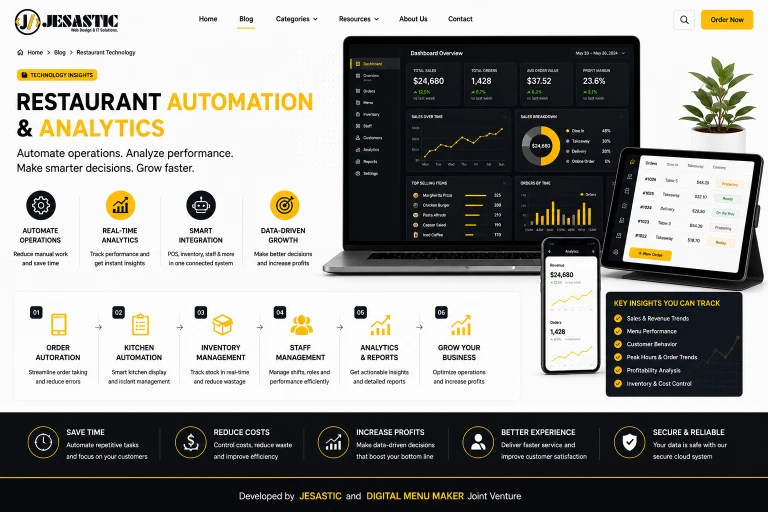
The modern operator must shift from reactive management to predictive management. To do this, you must transform the massive volume of raw data generated by your Point of Sale (POS) and digital ordering systems into actionable restaurant analytics. Proper data interpretation bridges the gap between chaotic daily operations and scalable, systemized growth.
Moving Beyond Gross Sales: The Metrics That Matter
Most independent owners check their end-of-day Z-report, look at the top-line revenue, and call it a day. This is a fatal flaw. High revenue means nothing if your variable costs scale aggressively alongside it. To gain a microscopic view of your performance, you need to track advanced operational metrics.
RevPASH (Revenue Per Available Seat Hour): This metric measures how efficiently you are utilizing your physical real estate. By dividing your total revenue by the number of available seats multiplied by the hours open, you isolate dead zones in your day. If your RevPASH plummets between 2 PM and 5 PM, it is a mathematical signal to reduce labor, close the dining room, or launch a targeted happy-hour promotion.
Menu Item Profitability vs. Popularity: It is not enough to know what sells the most. You must plot every menu item on a matrix analyzing its raw sales volume against its contribution margin. If your best-selling dish yields a mere 10% margin, your menu is working against you. Analytics allow you to identify these items and tweak the recipe or pricing to protect your bottom line.
Unlocking Digital Menu Analytics
Traditional paper menus are a black hole for data. You know what a customer eventually ordered, but you have zero visibility into their decision-making process. When you deploy a mobile QR menu ecosystem, you unlock e-commerce level analytics in a physical dining space.
Digital analytics track "dwell time" (how long a user looks at a specific category) and click-through rates. For example, if analytics show that 40% of users click on your high-margin Wagyu Burger, but only 5% actually add it to their cart, the data is telling you there is a friction point. Perhaps the price is slightly too high, or the item description lacks a compelling hook. You can then A/B test a new price or description instantly, without the cost of reprinting physical assets.
Predictive Labor Forecasting
As discussed in our guide to restaurant automation, labor is the most volatile variable expense you face. Overstaffing bleeds cash; understaffing ruins the guest experience and destroys future revenue.
Predictive analytics engines ingest historical POS sales data and cross-reference it with external variables—such as local weather forecasts, upcoming sporting events, and seasonal holidays. The software then generates a highly accurate, 15-minute increment labor forecast. This allows general managers to schedule shifts based on algorithmic demand projections rather than guesswork, routinely shaving 2% to 4% off total labor costs.
The Feedback Loop: Guest Sentiment Analysis
Customer feedback should not be limited to reading Yelp reviews days after a bad service experience. Advanced restaurant tech platforms integrate automated sentiment analysis directly into the digital checkout process. By prompting guests for a quick 1-to-5 star rating immediately upon paying their bill via their smartphone, operators capture authentic, real-time data.
If a specific shift consistently registers lower service scores, management can immediately investigate the floor dynamics, retrain staff, or adjust kitchen workflows before the negative sentiment spills over into public online review ecosystems.